MPGAfold (Massively Parallel Genetic Algorithm)

A genetic algorithm was developed to explore the very large search space of RNA secondary structure conformations for an optimal solution. A sequence of nucleotides that has a length of n would have the expected number of valid secondary structures on the order of O(1.8n). Originally, this genetic algorithm was implementated on a MasPar MP-2, a massively parallel SIMD architecture with 16,384 processors. It has also been adapted to MIMD parallel machines including Linux clusters using the MPI-2 and SHMEM libraries (Shapiro et al. 2001a, 2001b, 2001c), as well as single or dual processor workstations, such as SGI Octane. This makes it relatively easy to vary the population sizes between 2K and 256K and even more. In the RNA folding, the GA iterates mainly over a three-step evolution-like procedure including selection, mutation, and recombination operators, and using free energy as a criterion to improve secondary structures across all processors, in parallel, at each generation (an iteration constitutes one generation). Initially, during a preprocessing phase, the GA generates a stem pool consisting of all possible fully or partly zipped stems from the given sequence.
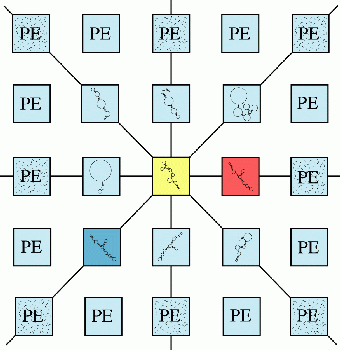
At each generation, in each processor, the GA selects two structures contained within two neighboring processors (assuming the eight-way interconnected mesh) using a ranked rule (biased towards the better free energies) and takes them as parents P1 and P2.
Then, the GA mutates the RNA structures by randomly inserting stems from the stem pool, according to a mutation operator, to form two child-structures C1 and C2. Overlapping stems are probabilistically peeled back to resolve the conflicts, and formation of H-type pseudoknots is permitted.
Next, the GA does a crossover operation between (P1, P2) and (C1, C2) to complete the two new structures, by distributing stems from P1 and P2 to C1 and C2, again eliminating conflicts by a probabilistic peelback when they occur.
Finally, between these two new structures the GA chooses the one with better free energy to become the secondary structure of the generation in the corresponding processor. Thus, 10,000's of new structures are created at each generation. (Shapiro and Navetta 1994)

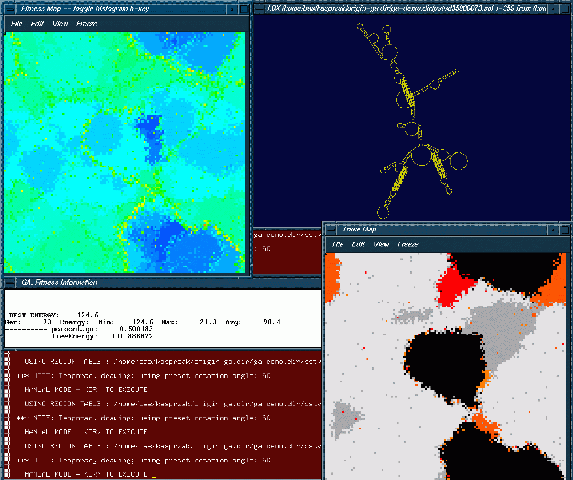
This process can be followed visually in three windows, a fitness window (upper left corner), a trace window (lower right corner), and a structure window (upper right corner). The fitness and trace windows display a two-dimensional grid that represents the processor array. Each cell of the grid is color-coded to represent particular values. The color scale for the fitness window starts with shades of red and moves through greens towards the shades of blue. Red represents the worst fitness, and blue represents the best fitness. The trace window allows the user to view which processors contain conformations that match structural motifs pre-specified in an input file. Each motif from the input file has a unique color associated with it to allow the user to follow the motifs as they spread through the population. A gray scale is used when a processor has more then one of the structural motif stems in it. The lighter the gray the more of the specified structural motif stems are in the processor. The structure window displays a current best structure in the population, one of potentially many equally fit.
A Comparison of GA Mutation Operators

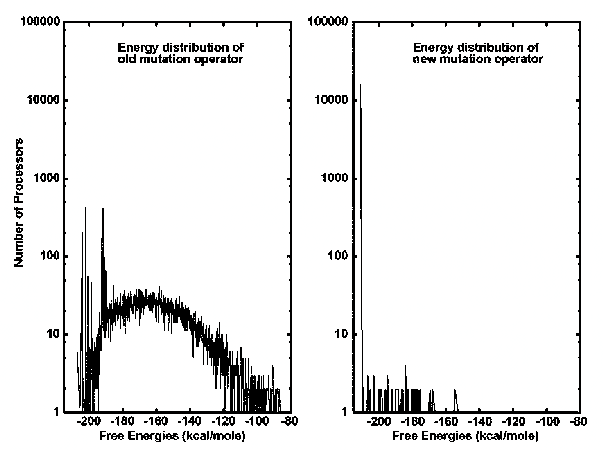
The mutation operator that was previously used in the GA assumed that the mutation probability p remained constant (usually chosen as 0.011). Therefore, the total number of mutations at each generation grew proportionally with the size of the secondary structure. That is, the old mutation operator allowed a few mutations to take place at the very beginning of the process, and increased the total number of mutations at each generation as the size of the secondary structures increased. For instance, at the very beginning, when the size of the secondary structure is one stem, the total number of mutations allowed on all processors was only ~176 (given a population of 16K); however, as the sized of the secondary structure grew, for example, to 100 stems, the total number of mutations got as large as 17,600. As a result, for long sequences generating large-size secondary structures, the old mutation operator made the distribution of free energies over all processors, representing secondary structures of RNA, very diverse even after thousands of generations.
The new annealing mutation operator behaves in the opposite way. That is, it allows a fairly large number of mutations to take place across all processors when the process starts, and reduces the total number of mutations at each generation as the sizes of the secondary structures increase. Especially for long RNA sequences with thousands of nucleotides contrasted to hundreds of nucleotides, the new annealing mutation operator can make the distribution of free energies over all processors converge only after hundreds of iterations.(Shapiro and Wu 1996)
Both graphs have a y-axis representing the number of processors and an x-axis representing the Free Energies. The left side depicts the old mutation operator. It can be seen that the old mutation operator is more spread out over the range of free energies (kcal/mole). The right side shows the new annealing mutation operator. It can be seen that the new mutation operator has one major peak in the mid -200 kcal/mole of free energy. There are some other smaller peaks to the right of it, but the main peak is at that lowest free energy.
Pseudoknots
An explanation of a Pseudoknot.
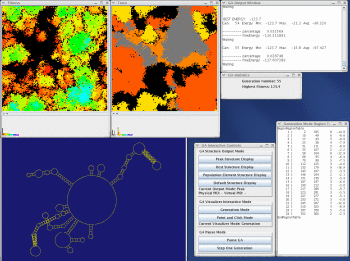
The figure to the left is an example of the H. Martinez's rna_2d3d program communicating via a dedicated socket with the GA and drawing (2D and 3D) pictures of the best solution of the GA. Based on evidence up to this point, it appears that pseudoknot interactions constitute only a marginal free energy gain upon the folding of an RNA molecule in comparison to the associated secondary structure. The fitness criteria of the GA will tend to favor structures that have pseudoknots that produce a better free energy than the comparable structure without the pseudoknot. Stem formation in structures may occur in any order. However, if one stem or group of stems is more energetically favorable then another, there would be a tendency for the more energetically favorable stems to form first. This does not exclude the possibility of the formation of multiple stems in a given generation. (Shapiro and Wu 1997)


Take a look at the MPGAfold, MPGAfold Visualizer, and StructureLab demo displaying an RNA folding pathway.