Pseudoknot


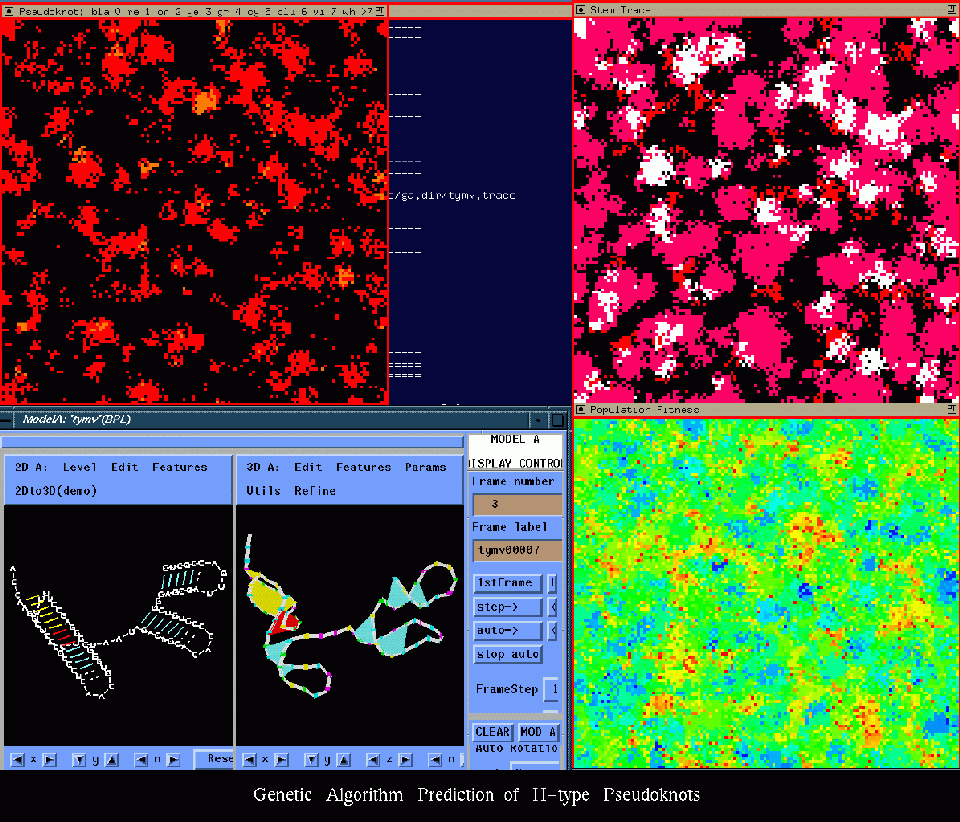
In the top left panel in the figure above is a window that is following the development of the number of pseudoknots in each structure. Black stands for 0 pseudoknots, red 1, orange 2, yellow 3, green 4, cyan 5 blue 6, violet 7, and white is greater then seven. In the top right panel there is a Stem Trace window that is following the 2 stems that make the pseudoknots. There is a color designated for each of the stems. Processors that contain one of the stems will show up in the designated color in the window. When a processor contains both stems it shows up as white and when the processor contains neither of the stems it appears black. In the bottom right panel there is a population fitness window. Red denotes poor fitness. The colors move through green to blue, which indicates good fitness. In the bottom left panel is a window showing the 2D and 3D structure of a particular stem drawn by H. Martinez's rna_2d3d program.